You’re staring at flat charts wondering how we built a 3D map of two billion stars. Good question. Gaia tracks positions from space, using parallax like your eyes do to measure depth. It reveals the Sun’s spot in a dusty disk and finds hidden waves of new stars. Obviously, this changes how you see our galaxy’s history. Stick around to unearth exactly how those tiny shifts reveal the Milky Way’s secrets.
What Is the Gaia 3D Milky Way Map?
That swirling band of light you see at night? You’re looking at our galaxy’s flat projection. Gaia changes that view entirely by building a massive 3D visualization of the Milky Way. It tracks nearly two billion objects, not just their positions but their motion too.
Now, imagine holding the galaxy in your hands instead of staring at a flat picture. This map reveals stellar composition and brightness for over 1.8 billion stars specifically. You get precise coordinates that let astronomers reconstruct the true structure of space. Just as understanding optical resolution is vital for selecting ground-based equipment, Gaia’s ability to distinguish fine details allows it to map the sky with unmatched clarity.
Here’s the thing: this isn’t just a pretty image; it’s a multi-dimensional catalog. You can explore dense star clusters or faint regions stretching 4,000 light-years away. The data helps you understand how our galaxy formed and evolved over time. By utilizing 44 million ordinary stars, the mission bridges critical gaps in our observational capabilities to create this unprecedented view. Just as selecting the right telescope optics determines what a stargazer can see from Earth, Gaia’s specialized instruments define the precision of this cosmic survey. Much like choosing a mount with stable tracking ensures clear views during long observation sessions, the satellite’s steady scanning law allows it to capture consistent data across the entire celestial sphere.
You now hold the keys to the galaxy’s deepest secrets. Ready to see how scientists actually measure these impossible distances?
How Does Gaia Measure Star Positions?
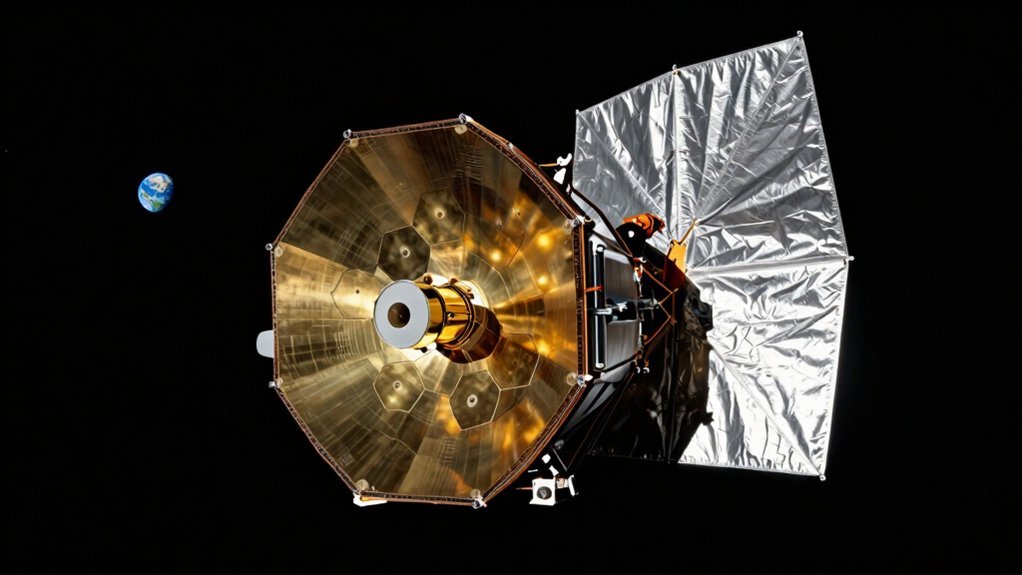
You’re wondering how we pin down stars light-years away without atmospheric blur messing everything up. Gaia sits at the L2 point, far from Earth’s distorting air. It uses two telescopes separated by 106.5 degrees to make precise angular measurements. This dual-view design lets the spacecraft compare stellar positions systematically every single day.
Now, Gaia doesn’t just snap one photo; it scans the sky repeatedly. Over five years, you get about seventy observations per star on average. This constant sweeping builds an interlocking grid across the entire cosmos. The massive billion-pixel camera tracks stars drifting by with pinpoint precision.
Here’s the thing: bright stars reach a positional accuracy of just 24 microarcseconds. That is like measuring a coin on the Moon from Earth. You now understand how Gaia maps over a billion stars so accurately. Just as selecting the right optics is critical for understanding telescopes, Gaia’s specialized dual-telescope configuration is essential for eliminating atmospheric distortion and achieving such high precision. To see fainter objects clearly, observers must also consider light pollution which can wash out the details needed for such precise astronomical work. Choosing the correct aperture size ensures that enough light is gathered to resolve these minute shifts effectively. Next, let’s explore why these tiny shifts actually matter for our 3D map.
Why Do Parallax and Motion Matter?
Since you’ve seen how Gaia measures positions, you’re probably wondering why those tiny shifts actually matter for a 3D map. Parallax turns flat views into real star distances using simple trigonometry. Larger angles mean closer stars, while tiny shifts signal vast cosmic gaps. Utilizing Earth’s orbit as a wider base significantly improves the accuracy of these distance measurements.
Now, proper motion tracks stellar motions as stars drift sideways across the sky. Gaia watches each star about 70 times to catch these subtle moves. This data separates true neighbors from distant objects that just look close together. Unlike ground-based telescope options which struggle with atmospheric distortion, Gaia’s space-based vantage point ensures the precision needed for such a comprehensive catalog. Understanding the optical aperture is also vital, as a larger light-gathering area allows instruments to detect the fainter stars essential for completing the galactic picture. A telescope with a larger primary mirror collects more light, enabling the detection of dimmer stars that are crucial for mapping the galaxy’s outer regions.
Here’s the thing: combining distance and movement builds a dynamic 3D model of our Galaxy. You get more than static points; you see the Milky Way’s structure evolving over time. These precise measurements reveal gravity’s grip and the Galaxy’s hidden mass distribution.
Obviously, without these metrics, we’d only have a flat, confusing snapshot of space. You now hold the key to understanding our Galaxy’s true shape and history. Ready to see just how many stars fill this incredible new map?
How Many Stars Are in the 3D Map?
While you might expect a single total, the answer depends on which map you’re looking at. For the specialized 3D view of star forming regions, Gaia uses 44 million ordinary stars plus 87 massive O-type stars. This specific dataset reconstructs nearby stellar nurseries within 4,000 light-years of you.
Now, don’t confuse this regional map with Gaia’s broader catalog containing over 1.8 billion stars. The 44-million count focuses strictly on mapping dusty clouds where new stars birth, not the whole galaxy. Obviously, this smaller number gives you incredible detail on local structures like the Gum Nebula.
Here’s the thing: you get a precise local volume rather than a full census. This targeted approach reveals hidden details in opaque clouds that wider surveys miss. You now know exactly how many stars define your immediate neighborhood in this unique 3D reconstruction. For enthusiasts seeking to observe these regions, understanding optical transparency is essential for selecting the right equipment to pierce through the remaining dust. When choosing the right telescope, considering optics and performance ensures you can effectively view these detailed stellar formations. Different telescope designs offer varying levels of light gathering power which is critical when attempting to resolve faint structures within these dense stellar nurseries.
Where Is the Sun in This 3D View?
Actually, you reside far from the Galactic core, tucked safely within the Milky Way’s flattened disk. The map extends roughly 4,000 light-years outward from your doorstep, making nearby nebulae look huge while the true center glows distantly. You aren’t in the crowded bulge; you’re in a quieter spiral arm section. This off-center location lets astronomers study the galaxy without getting blinded by the core’s intense radiation. This perspective is possible because the Gaia spacecraft mapped 44 million ordinary stars to create the first detailed 3D view of our cosmic neighborhood. By analyzing the precise positions and movements of these stars, experts can determine the stellar parallax required to calculate accurate distances for this immersive galactic model. Just as selecting the right telescope depends on understanding optical resolution to distinguish fine details, interpreting this vast map requires grasping how distance measurements define our spatial context. Similarly, choosing the best instrument for observing these mapped stars relies heavily on evaluating light gathering power to reveal faint objects within the galactic disk.
How Is the 3D Dust Map Created?
Two massive datasets power this map, turning billions of faint star signals into a clear 3D picture. You might wonder how we see invisible dust. Gaia measures stellar dimming to reveal hidden clouds.
Scientists compare expected brightness against actual light. This dust estimation process uses 130 million spectra. Machine learning models then predict reddening for each star.
Tomographic inversion treats stars as probes through space. Algorithms model dust density across 516 distance bins. Gaussian processes smooth out artifacts in the final reconstruction.
You now hold a volumetric view, not a flat image. The math handles over 661 million degrees of freedom. Obviously, combining surveys like Pan-STARRS improves sky coverage markedly. Just as selecting the right optical design is crucial for telescope performance, the choice of data processing methods determines the clarity of the resulting galactic map. Understanding the specific light gathering capability of an instrument is equally vital when interpreting the faint signals used to construct these detailed cosmic maps.
This method transforms simple dimming data into complex structures. You can finally trace the galaxy’s dusty skeleton accurately. Ready to see what shapes these clouds actually form? Just as enthusiasts learn to optimize their gear for clearer views, researchers apply tomographic inversion to reconstruct the three-dimensional distribution of interstellar dust with high precision.
What Galactic Structures Did Gaia Find?
You’re probably wondering what shapes actually hide in that dust. Gaia’s Radcliffe Wave revelation revealed a massive, undulating nursery stretching 9,000 light-years right near us. Previously isolated Molecular cloud structures now appear as one coherent, thin ensemble rather than scattered fragments.
Now, consider the Local Bubble origins; this peanut-shaped cavity surrounds our Sun along its galactic orbit. Outer disc filaments also emerged, showing spinning relics of past spiral arms in a warped disk. These findings prove our galaxy isn’t flat but dynamically disturbed by ancient forces. The mission further provided estimates of the galaxy’s total mass, including the elusive dark matter halo.
Ancient stellar streams like Shakti and Shiva weave through space, holding stars over twelve billion years old. They mark major Galactic mergers, including the colossal Gaia-Sausage-Enceladus collision that shaped our early history. You see clear evidence of violent cosmic interactions preserved in stellar motions today. These structures transform your understanding of the Milky Way’s chaotic, beautiful evolution. What caused such massive disturbances long ago?
When Did the Gaia Mission Start and End?
Those ancient stellar streams beg the question of how we mapped them so precisely. You need the exact mission timeline to understand this incredible feat. Gaia launched on December 19, 2013, and started science operations by July 2014.
Originally, you’d expect a five-year run, but engineers extended it considerably. Operational milestones include collecting over three trillion observations before January 15, 2026. That date marked the final sky scan after eleven amazing years.
ESA finally shut down the spacecraft on March 27, 2026. You now know the full span from launch to retirement. This extended life allowed unprecedented data collection for your research. Obviously, those extra years mattered immensely for our galactic map. The mission relied on a specialized focal plane array to capture the precise positional data required for such a detailed 3D map.
You’ve got the dates; now consider how this data changes astronomy. What will you uncover next using these precise measurements? Understanding optical telescope design helps explain how Gaia achieved such astrometric precision over such vast distances.